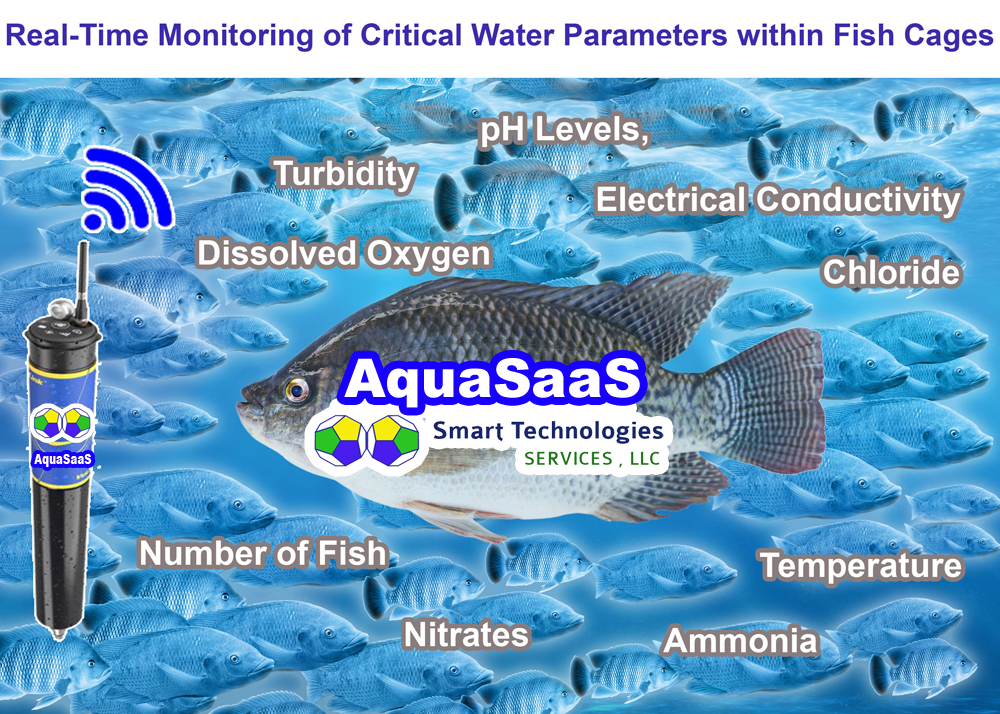
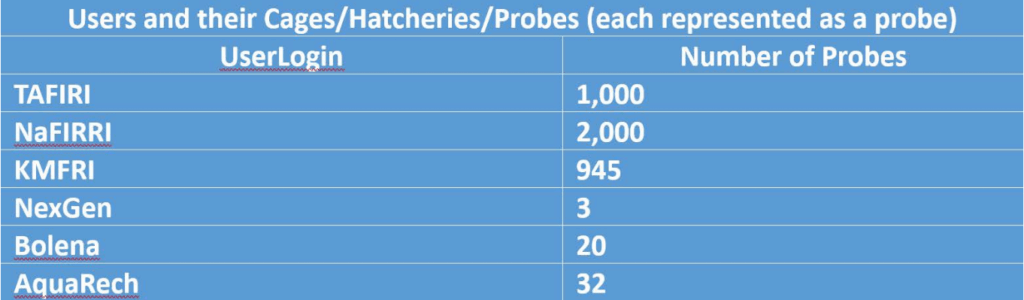
Objective: There are more than4,000 probes throughout Lake Victoria and gather data (key performance indicators as identified by aquaculture scientists and experts), which would be useful for fish cage farmers. This data will be archived and made available to aquaculture and computer science professors. This data may be used to gain a better understanding of the conditions in Lake Victoria and enable deterministic predictions based on historical data.
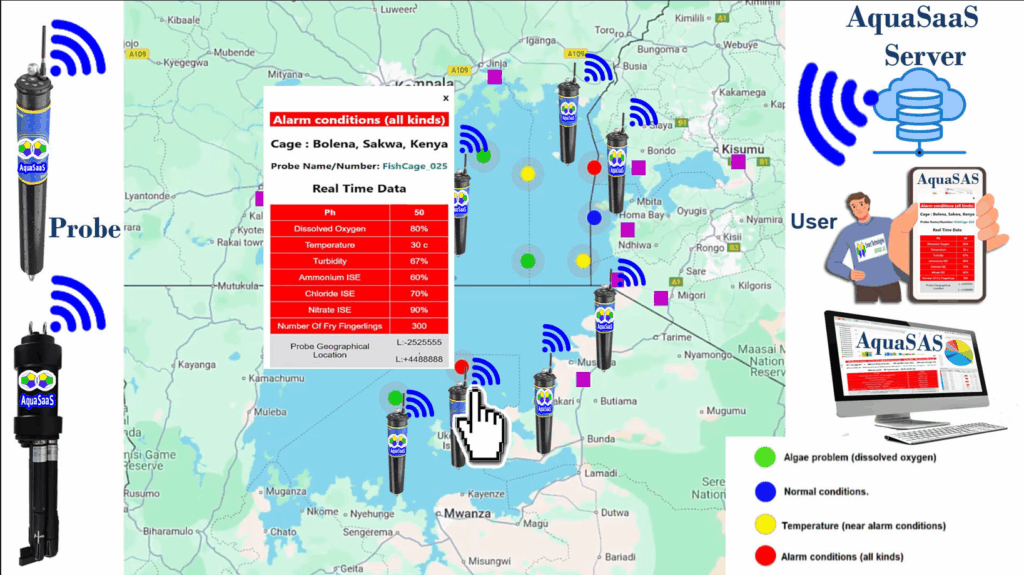
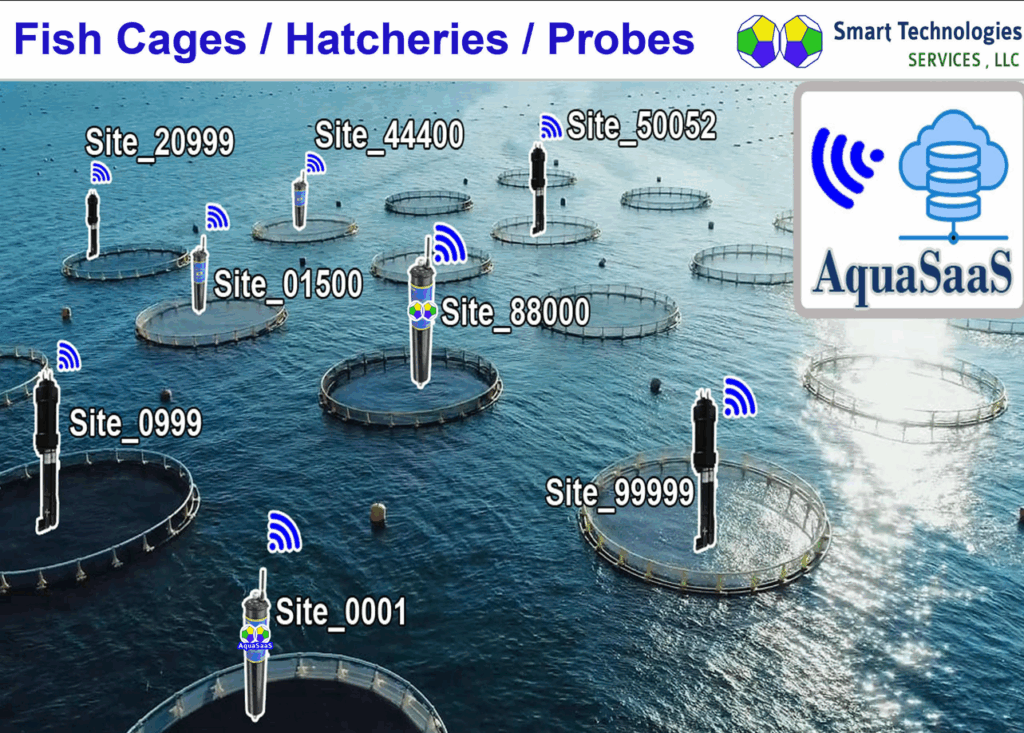
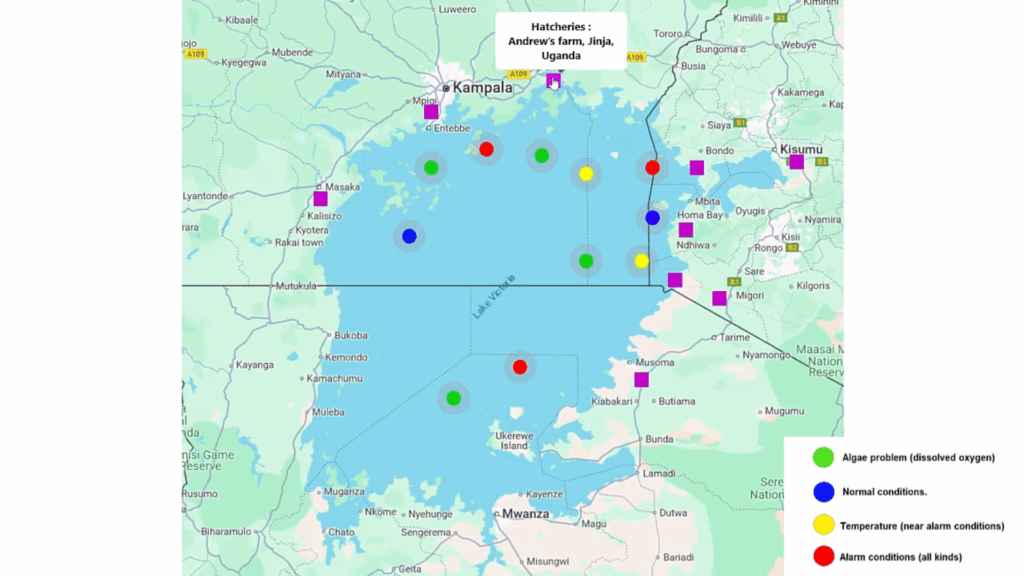
Simulation: There are several hot spots on the map to represent the location of the probe, which can be identified by GEO location coordinates. Each probe will be equipped to simulate the points in the existing prototype station.
Functionality: When user click on the hot spot should show/display the exact geographical location of the probe and the data on that probe.
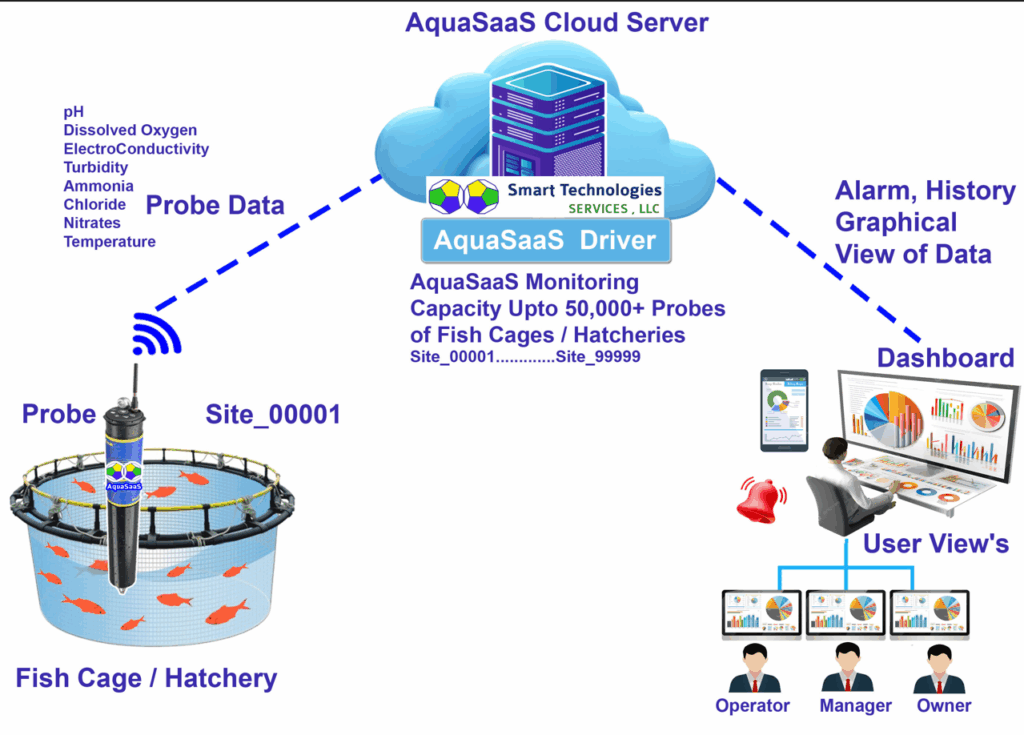
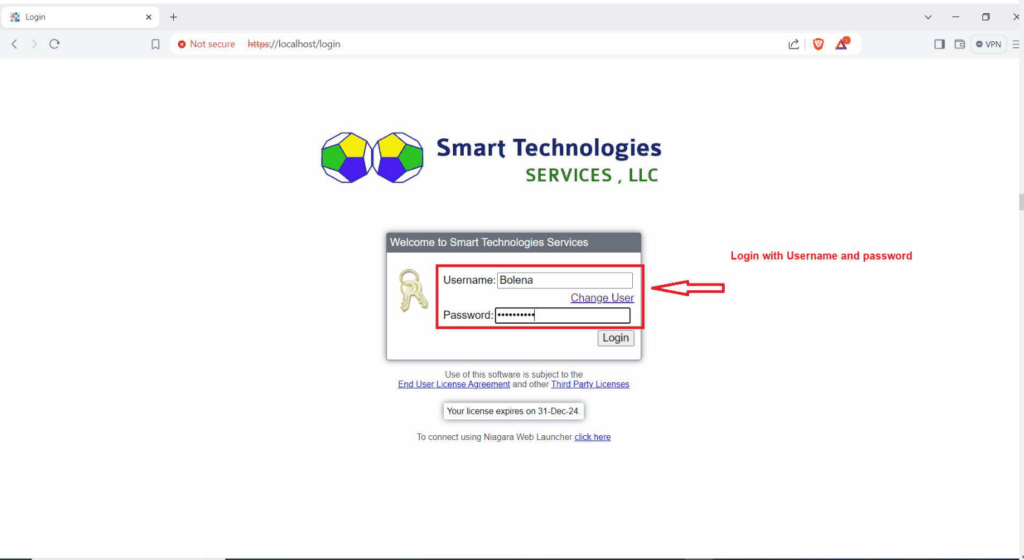
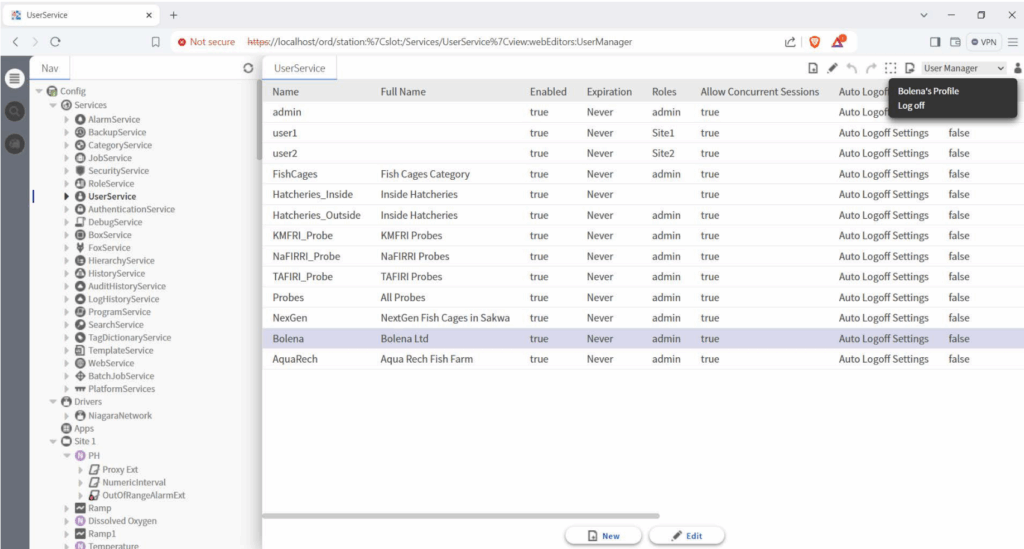
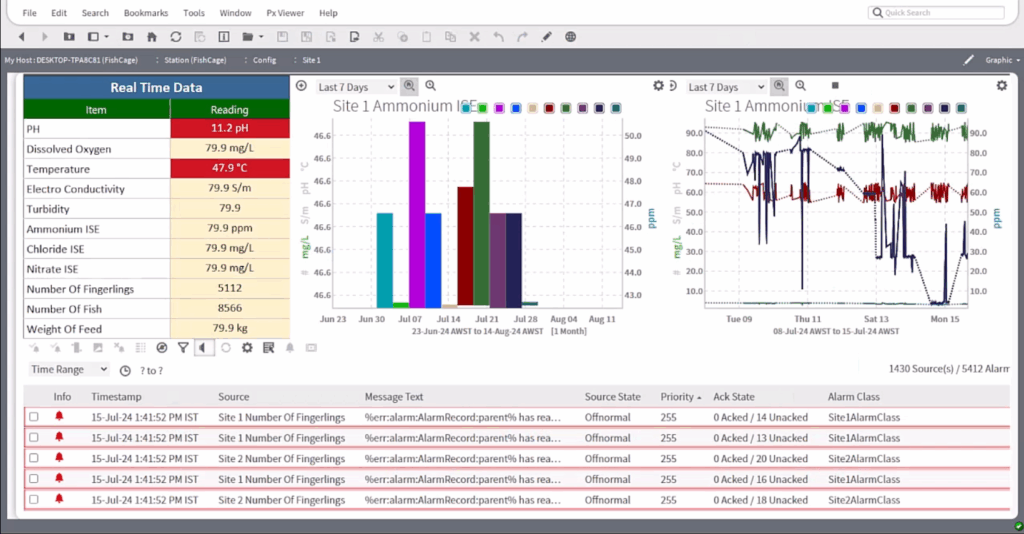
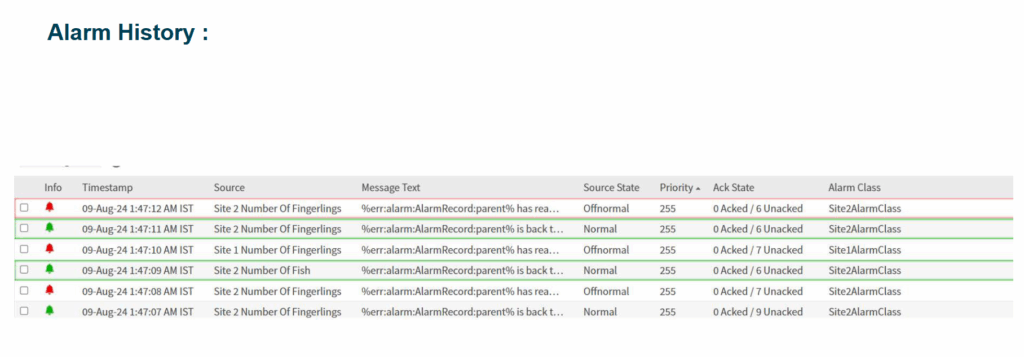
log alarm conditions at an appropriate frequency (every day, every hour, every 15 minutes, every minute, etc.). A dashboard provided to visibly show the status of the lake relative to the conditions being monitored. The dashboard display the data in a variety of formats: table, line graph, bar graph, and pie chart. Is a heatmap graphic meaningful in this situation On AquaSaaS Smart Fish Cage station , User can access station with UserName and password. Once user login successfully, User can access to the individual probes/hatcheries/fish cages e.g. Bolena User after successfully login with UserName and Password to station. Then Bolena User can access to the individual probes/hatcheries/fish cages
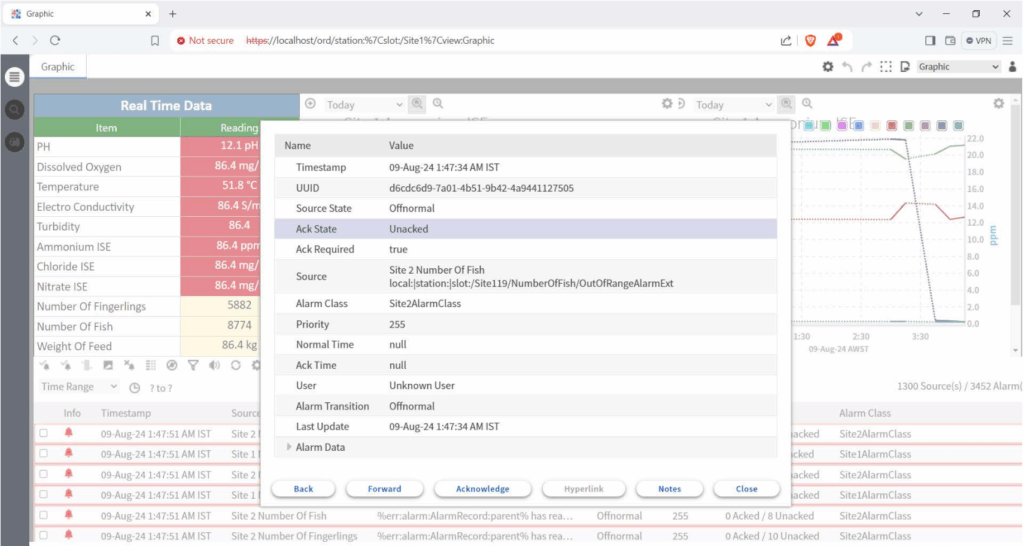
Each login will only have access to their probes: Access to history logs, charts, and alarms. map Have the dots be in a combination of these colors: green, blue, yellow, and red. map dots representing hot spots (green, blue, yellow, red), which represent sites. Green: Algae problem (dissolved oxygen) Blue: Normal conditions. Yellow: Temperature (near alarm conditions) Red: Alarm conditions (all kinds)
Click on the dot to see: Country, City/village/Probe Owner/Probe Number/probe Name. • Kenya, Sakwa, Bolena, FishCage_03 • Kenya, Migori, Victory Farms, FishCage_056 • Kenya, HomaBay, Victory Farms, FishCage_054 • Kenya, Migori, KMFRI, Probe_180 • Kenya, Kisumu, KMFRI, Probe_990 • Uganda, Jinja, Andrew’s farm, FishCage_10 • Uganda, Masaka, NaFIRRI, Probe_909 • Uganda, Entebe, NaFIRRI, Probe_810 • Uganda, Entebe, NaFIRRI, Probe_099 • Tanzania, Musoma, TAFIRI, Probe_081 • Tanzania, Musoma, TAFIRI, Probe_181 On this map when Click on a fish cage and see data and all the alarms associated with that fish cage.
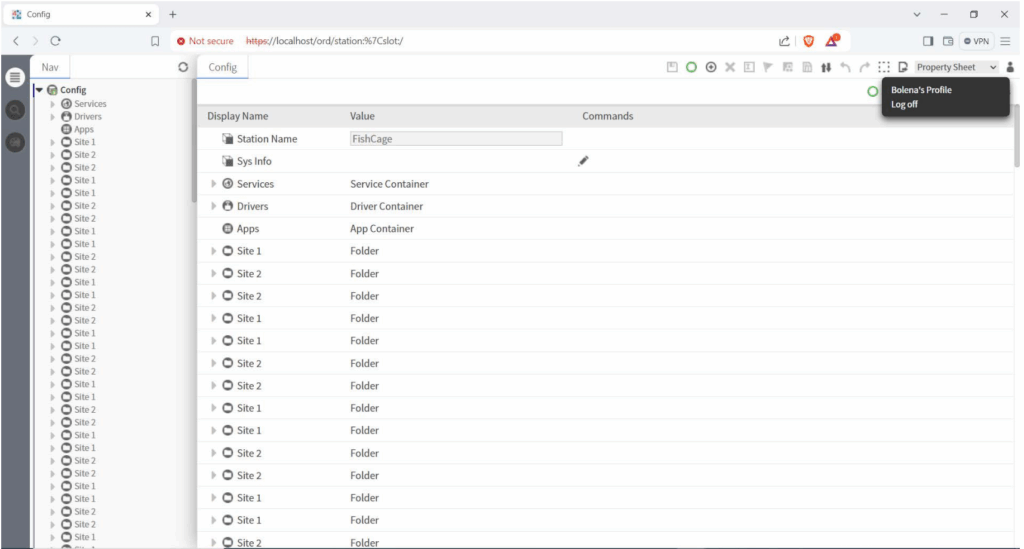
User Login :
On AquaSaaS Smart Fish Cage Station, User can access station with UserName and password. Once user login successfully, User can access to the individual probes/hatcheries/fish cages e.g. Bolena User after successfully login with UserName and Password to station. Then Bolena User can access to the individual probes/hatcheries/fish cages